
|
METRIC |
IMPERIAL
|
Updated: 07/18/2026 @ 6:07 pm (0 sec ago) | |||||||||||||||||||||||||||||||||||||||||||||||||||||||||||||||||||||
| Temperature | Current Conditions | Forecast / Storm Prediction | ||||||||||||||||||||||||||||||||||||||||||||||||||||||||||||||||||||
|
|
|
||||||||||||||||||||||||||||||||||||||||||||||||||||||||||||||||||||
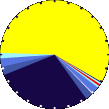
| Dew Point | Liquid Precipitation | Wind Speed | Sun/Moon | |||||||||||||||||||||||||||||||||||||||||||||||||||||||||||||||||||
|
|
|
|
|||||||||||||||||||||||||||||||||||||||||||||||||||||||||||||||||||
| Humidity | Barometer | |||||||||||||||||||||||||||||||||||||||||||||||||||||||||||||||||||||
|
|
|||||||||||||||||||||||||||||||||||||||||||||||||||||||||||||||||||||
| Cooling Degree Days | Lightning Strikes | Heat Index | Air | |||||||||||||||||||||||||||||||||||||||||||||||||||||||||||||||||||
|
|
|
|
|||||||||||||||||||||||||||||||||||||||||||||||||||||||||||||||||||
| Current UV Index | Current Solar Energy9 | |||||||||||||||||||||||||||||||||||||||||||||||||||||||||||||||||||||
|
|
|||||||||||||||||||||||||||||||||||||||||||||||||||||||||||||||||||||
| Almanac | Irrigation Index5 | Station All Time Records | Cloud Level | |||||||||||||||||||||||||||||||||||||||||||||||||||||||||||||||||||
|
|
|
|
|||||||||||||||||||||||||||||||||||||||||||||||||||||||||||||||||||


| 1 Rain season: Jan 1st to Dec 31st. 5 Estimated amount of water needed to replace the water used by plants and evaporation from the past week. (Negative numbers mean amount of water needed, positive numbers mean excess water is present). 6 Air Quality Index is provided by Colorado Air Quality Agency and is updated hourly between the hours of 6AM and Midnight. 9 Solar Index represents either an absolute scale of solar energy (W/m²) using the station’s recorded maximum or a percentage of computed theoretical solar maximum using the station’s location and time of day. These indices differ most when the sun is low on the horizon. The current scale is shown, and will toggle if it or the icon is clicked. 10 Historical average only to day 18 of just the month of July for this station since 2022. 11 Historical average rain this season to day 18 of July for this station since 2022. |
| NWS Weather Forecast - Outlook Tonight & Sunday | |||||
|
|||||
|
ajax-dashboard6.php - Version 6.95h - 20-Feb-2023 - Script by: Scott of BurnsvilleWeatherLIVE.com Now supported by Saratoga-weather.org Download |
|||||

|
|
| Local Radar | |
| Radar/Satellite images courtesy of NOAA/NWS and Weather Underground. | |